Machine Scrap Prediction Analytics
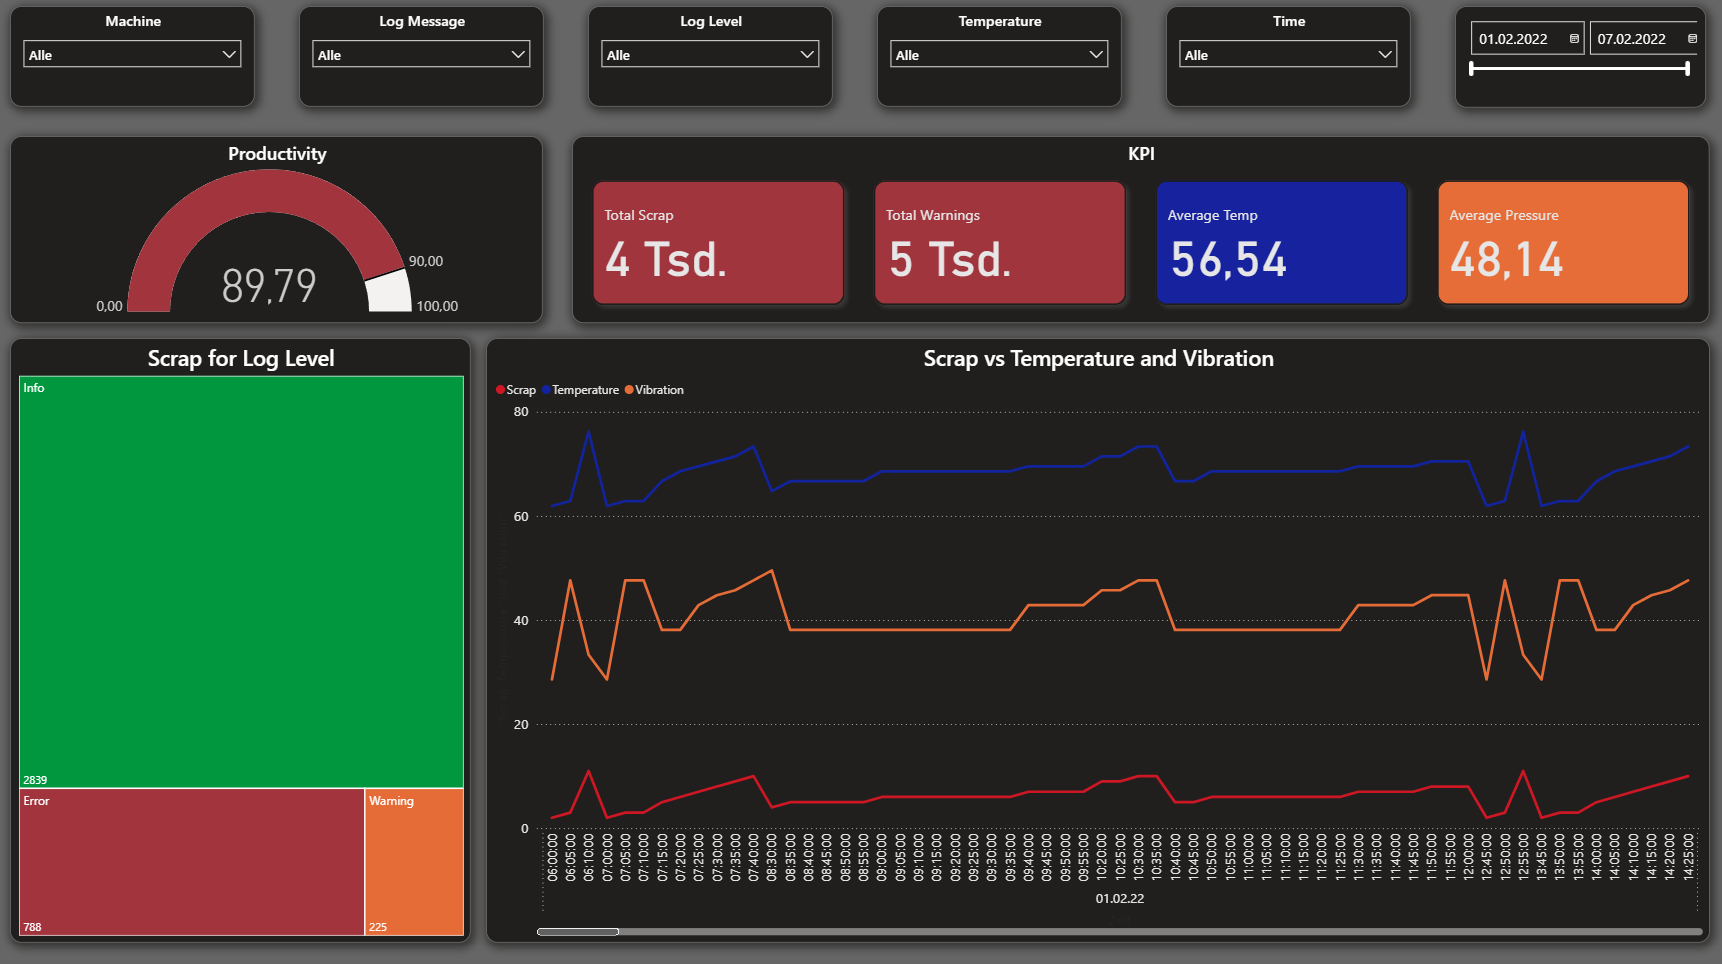
An interactive Power BI dashboard that visualizes machine data and provides insights for predicting manufacturing scrap based on operational features and performance metrics.
Problem Statement
Manufacturing operations generate vast amounts of machine data, but extracting actionable insights for quality control and scrap reduction remains challenging. Traditional reporting methods fail to identify patterns that could predict when machines are likely to produce defective parts, leading to increased waste, higher costs, and reduced operational efficiency. The goal was to create a comprehensive visualization solution that transforms raw machine data into predictive insights for scrap prevention.
My Solution
I developed an interactive Power BI dashboard that combines big data management with predictive analytics:
- Big Data Processing: Comprehensive analysis and processing of large-scale machine data sets, handling multiple data sources and operational parameters to create a unified view of manufacturing performance.
- Feature Engineering: Strategic identification and transformation of key operational features including machine performance metrics, environmental conditions, production parameters, and historical quality indicators.
- Predictive Analytics Integration: Implementation of machine learning models to predict scrap probability based on real-time machine data and operational conditions.
- Interactive Visualizations: Development of dynamic Power BI dashboards featuring drill-down capabilities, trend analysis, and real-time monitoring of key performance indicators.
- Operational Insights: Creation of actionable visualizations that help manufacturing teams identify risk factors and optimize machine settings to minimize scrap production.
Key Features
- Real-Time Machine Monitoring: Live visualization of machine performance metrics and operational status
- Scrap Prediction Models: Predictive analytics showing probability of defective production based on current conditions
- Historical Trend Analysis: Time-series visualizations revealing patterns in machine performance and quality outcomes
- Feature Importance Dashboard: Clear visualization of which operational parameters most significantly impact scrap rates
- Interactive Filtering: Dynamic filtering capabilities allowing users to analyze specific machines, time periods, or production conditions
- Performance KPIs: Key performance indicators tracking overall equipment effectiveness and quality metrics
Technical Implementation
The project leverages Power BI for advanced data visualization combined with big data management techniques for processing large-scale manufacturing datasets. The dashboard integrates multiple data sources and applies statistical analysis to identify correlations between machine parameters and scrap production, enabling proactive quality management decisions.